Azure has the capability to create alerts on all sorts of events. If it can be expressed as a metric on a resource in Azure, then you can get an alert if the metric value reaches a state you don’t like.
One of those metrics is the “Endpoint Status by Endpoint” of Azure Traffic Manager.
Traffic Manager has a number of backend endpoints to which it directs traffic. If an endpoint is down for some reason, it doesn’t get any traffic. This is part of what makes Traffic Manager smart.
But you probably want to know about it, when an endpoint is down. That is alerting on the “Endpoint Status by Endpoint” metric can do.
The chart for it can look like this:
While it is possible to go to the Azure Portal and create an alert on the metric, I prefer having my environments in complete sync, so I use ARM templates for all resource deployments. That includes alert configuration.
There is documentation on how to define metric alerts in ARM templates, however the documentation is missing one important thing: What if we decide later to add a new endpoint? The samples on the documentation page require you to know the exact resources to monitor.
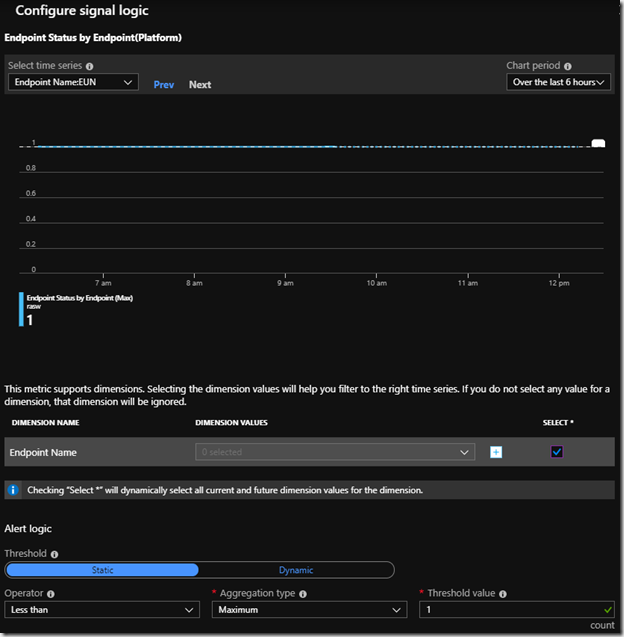
In the Portal, it is possible to check “select *” when creating a metric alert. This means it will monitor all current and future resources of the type.
The alert configuration in the Portal should look like this:
Note the “Select *” checkbox.
When all endpoints are online, the value is 1. So anything less than that should trigger an alert.
Since the documentation leaves out how to configure the “Select *” checkbox, I tried generating the ARM template using the Azure Portal, but the generated template leaves out the alert criteria completely. Luckily the metric’s resource ID is documented, so using that and some google-fu, I was able to create an ARM template which creates an alert like the above:
{
    "$schema": "https://schema.management.azure.com/schemas/2015-01-01/deploymentTemplate.json#",
    "contentVersion": "1.0.0.0",
    "parameters": {},
    "variables": {
        "actiongroup-name": "arm-action-group-name",
        "actiongroup-short-name": "arm-ag-short",
        "email-receiver": "alerts@example.com",
        "trafficManagerProfile": "prod-site-tm"
    },
    "resources": [
        {
            "type": "microsoft.insights/actionGroups",
            "apiVersion": "2019-03-01",
            "name": "[variables('actiongroup-name')]",
            "location": "Global",
            "properties": {
                "groupShortName": "[variables('actiongroup-short-name')]",
                "enabled": true,
                "emailReceivers": [
                    {
                        "name": "arm-email-action-name",
                        "emailAddress": "[variables('email-receiver')]",
                        "useCommonAlertSchema": true
                    }
                ],
                "smsReceivers": [],
                "webhookReceivers": [],
                "itsmReceivers": [],
                "azureAppPushReceivers": [],
                "automationRunbookReceivers": [],
                "voiceReceivers": [],
                "logicAppReceivers": [],
                "azureFunctionReceivers": []
            }
        },
        {
            "type": "microsoft.insights/metricAlerts",
            "apiVersion": "2018-03-01",
            "name": "arm-test-alert",
            "location": "global",
            "dependsOn": [
   //             "[resourceId('Microsoft.Network/trafficManagerProfiles', variables('trafficManagerProfile'))]",
                "[resourceId('microsoft.insights/actionGroups', variables('actiongroup-name'))]"
            ],
            "properties": {
                "description": "alert-rule-description",
                "severity": 2,
                "enabled": true,
                "scopes": [
                    "[resourceId('Microsoft.Network/trafficManagerProfiles', variables('trafficManagerProfile'))]"
                ],
                "evaluationFrequency": "PT1M",
                "windowSize": "PT1M",
                "criteria": {
                    "odata.type": "Microsoft.Azure.Monitor.SingleResourceMultipleMetricCriteria",
                    "allOf": [
                        {
                            "name":"ProbeAgentCurrentEndpointStateByProfileResourceId",
                            "metricName": "ProbeAgentCurrentEndpointStateByProfileResourceId",
                            "metricNamespace": "Microsoft.Network/trafficmanagerprofiles",
                            "threshold": 1,
                            "operator": "LessThan",
                            "dimensions": [
                                {
                                    "name": "EndpointName",
                                    "operator": "Include",
                                    "values": [ "*" ]
                                }
                            ],
                            "timeAggregation": "Maximum"

                        }
                    ]
                },
                "actions": [
                    {
                        "actionGroupId": "[resourceId('microsoft.insights/actionGroups', variables('actiongroup-name'))]",
                        "webHookProperties": {}
                    }
                ]
            }
        }
    ]
}
Note the criteria section near the bottom. The metric name must be ProbeAgentCurrentEndpointStateByProfileResourceId, and the metricNamespace must be Microsoft.Network/trafficmanagerprofiles, as that is what defines the endpoint status metric.
The threshold, operator and timeAggregation properties define the alert criteria – in case the “Maximum” value is less than 1, the alert is triggered.
The hard to find “select *” configuration is in the dimensions object. Instead of listing each of the Traffic Manager Endpoints in the values property, it is possible to simply put “*”.
I have left a commented out line in the template. The contents of that line is used if you create the Traffic Manager in the same template as the alert. In that case, you want to be sure that the Traffic Manager is created first. That is what the dependsOn property declares: You want those resources to be provisioned before this one.

