 In this part of the series I will look at using a WCF IParameterInspector implementation to time the actual WCF service operation and send the tracking metrics to Azure Application Insights.
The previous parts of this blog series have discussed adding the necessary NuGet packages to the Visual Studio project, so the Application Insights parts work, how to create a Telemetry Initializer to add information to each Application Insights tracking event, and how to use a WCF IDispatchMessageInspector to get information about each request to the WCF service.
In addition to using a message inspector which intercepts all calls before WCF has determined which operation it should invoke, it is also possible to add an inspector that is called just before and after WCF invokes each operation.
This is done using an implementation of the IParameterInspector interface. It has just two methods:
public object BeforeCall(string operationName, object[] inputs)
{
	var sw = new Stopwatch();
	sw.Start();
	return sw;
}

public void AfterCall(string operationName, object[] outputs, object returnValue, object correlationState)
{
	var sw = (Stopwatch) correlationState;
	// store operation name for message inspector End
	CallContext.LogicalSetData(ItemCorrelationTelemetryInitializer.OPERATION_NAME, operationName);
	telemetryClient.TrackEvent(operationName, null,
		new Dictionary<string, double>() {
			{ $"{operationName} Time (ms)", sw.ElapsedMilliseconds}
		}
	);
}
In my implementation of BeforeCall I simply start a Stopwatch and return it. The IParameterInspector methods work similar to IDispatchMessageInspector in that the return value from the Before-method is passed as a parameter to the After-method.
In AfterCall I retrieve the Stopwatch and call AI’s TelemetryClient.TrackEvent to log how long the operation took too invoke. That way I can track and graph each operation’s duration without the overhead of XML serialization and deserialization. I also store the operation name in CallContext. The operation name is used in my BeforeSendReply method of the IDispatchMessageInspector interface which is described in part two of this blog series.
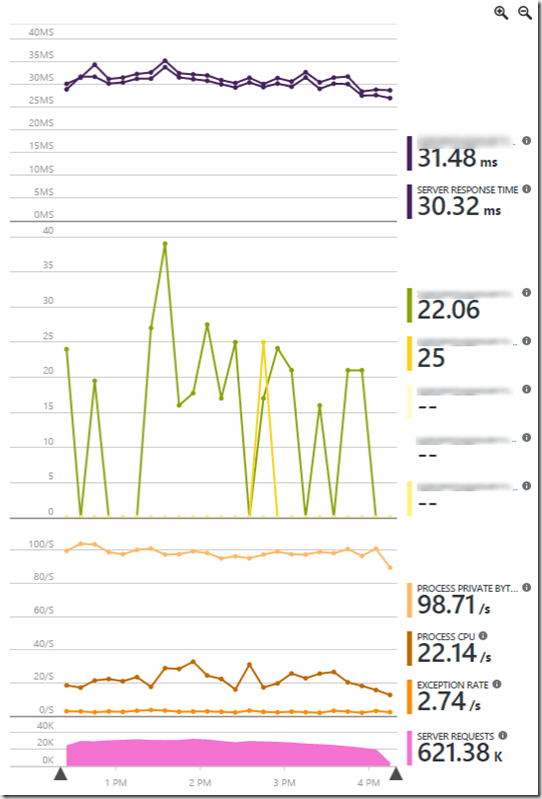
Now, with the time tracking of the requests, and of each different operation, I can monitor the service’s performance at a glance in the Azure Portal:
There seems to be a bug in the graph unites, when adding counters of different types to the same graph. I’m quite certain that “Process Private Bytes” is not measured in seconds…
I’m working on getting dependency calls to work properly. With the Azure Application Insights Agent, which can be installed on a server running IIS, it installs itself as a .net profiler to intercept dependency calls. But since this is a Windows Service, that won’t work the same way.
All previous parts of this series:

Hello, we found your articles useful and it helped to get our app insights working on an old WCF project.
What issue do you have with dependency tracking? We have an issue that some machines will track dependency events but others do not.
https://social.msdn.microsoft.com/Forums/vstudio/en-US/8672ec6b-2ca3-4f6e-b5e4-a6b6b2d87280/dependancy-tracking-does-not-work-on-some-machines?forum=ApplicationInsights
Thanks
Mark
Hi Mark,
The Application Insights agent software will install itself as a profiler for the IIS applications you select.
This solution runs as a Windows service which the AI agent won’t detect. It is possible to use the AI agent as a profiler for all .net programs by setting the Windows environment variables as described at http://apmtips.com/blog/2015/01/05/track-dependencies-in-console-application/ . I haven’t added it globally to our production server, because it broke other .net stuff on my test server. It should be possible to add the profiling environment variables to just the service process by defining them in the service part of the registry, but I haven’t tried it.
Rasmus
Hi Rasmus,
We have not used Azure Application Insights Agent or status monitor yet.
We have fixed our issue with dependency tracking, we needed to install .Net 4.6, which is why we had different results on our dev machines and server.
We also have an issue with performance tracking, it looks like we need to add the IIS app pool user to the performance monitor group, we are testing this now.
Thanks
Mark